Semantic Layer Series Part 3 of 6: The Three-Layer DAX Stack
DAX measure design is what decides whether a semantic layer scales. Build measure logic in three layers, or the same KPI shows up in three shapes.
An audit of the DAX behind churn_rate across the three highest-traffic reports of a governed semantic model returned three different formulas. One used DIVIDE with a default of zero. One used DIVIDE without a fallback. One wrapped the calculation in an IF that swapped behaviour during quarter-end. None of them produced the same number for the same period.
The model was already in place. The dashboards were live. The DAX had drifted because there was no measure-engineering discipline above the model. Drift in DAX is the failure mode that is hardest to detect because the model itself looks healthy; the symptoms only surface when a senior stakeholder compares the same KPI across two reports and finds the gap.
A semantic-layer team is either disciplined about which layer each measure lives in or about to discover the same KPI in three different shapes across the report estate. Once the layering collapses, every new measure references whichever underlying column is convenient and the dependency graph dissolves into spaghetti; once the layering holds, every business measure references base measures only and every consumption measure references business measures only, so a measure change in one layer propagates cleanly to the layer above. The way you get there is not stricter code review. It is The Three-Layer DAX Stack: a measure pattern where every measure declares which layer it lives in and what it references.
Why this matters now
DAX measure design is the part of the semantic layer that ages worst. The underlying model can stay stable for years while the measure layer accretes mass: more measures, more variants, more time-intelligence cuts, more team-specific cohort definitions. Each addition is fine on its own. The cumulative effect is a model where the same KPI is computed three different ways depending on which report the analyst picked up first.
The reason the rot is invisible is that nothing in the build pipeline catches it. A new measure compiles. A duplicate measure compiles. A measure that quietly overloads an existing one also compiles. The first surface that catches the drift is a senior stakeholder comparing the same KPI across two reports and asking why the numbers differ. By the time the comparison happens, the rot is at least a year old and the cleanup is a quarter of work.
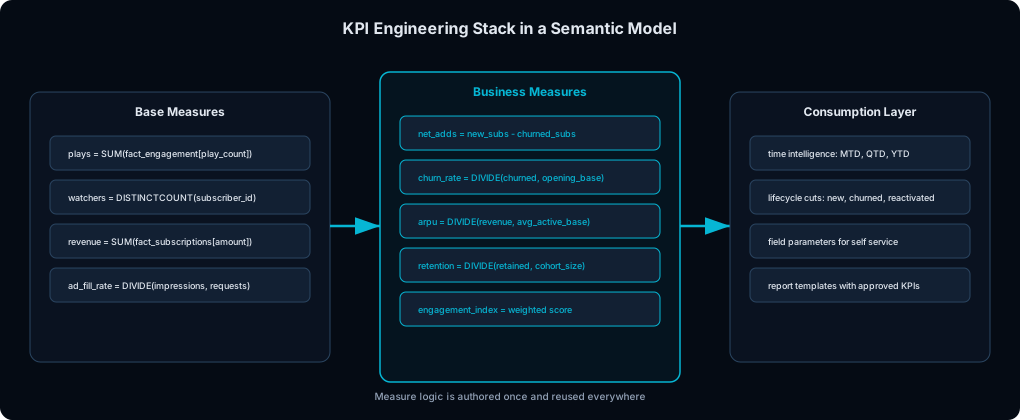
Layered measure design keeps KPI logic maintainable and reduces duplicated logic across dashboards.
The Three-Layer DAX Stack
Layer 1: Base measures
What it is. Direct aggregations from fact tables. Simple, explicit, reusable. In a streaming context the base measures typically cover plays, watchers, seconds_watched, plus AVOD-specific impressions and vast_errors. No business assumptions. No conditional logic. Pure aggregation.
Why it matters. The constraint is what makes the layer useful. A base measure with no hidden logic is one any consumer can stack on top of without inheriting surprises. The layer is also where every audit trace bottoms out: when a business measure produces an unexpected number, the debug path stops at the base measure that fed it.
What goes wrong without it. A base measure that includes a filter or a conditional is no longer a base measure; it is a business measure pretending to be a base measure. The consumer who builds a business measure on top of it inherits the hidden filter, the dependency graph breaks, and the audit trace dead-ends at a measure that does too much.
Layer 2: Business measures
What it is. KPI semantics expressed as ratios, differences, or compositions of base measures. net_adds, churn_rate, retention_rate, playtime_hrs. Each business measure references base measures only, never raw columns. The canonical shape is a DIVIDE over two base measures with a default fallback:
m_kpi_churn_rate = DIVIDE([m_base_churned], [m_base_opening_base], 0)Why it matters. This is where most governance value lives. The business measures are the shared language the organisation uses to talk about itself: every dashboard, every model, every executive review reads from this layer. The discipline that every business measure has a published contract (definition, inclusions, exclusions, validation query) is what makes one source of churn-rate exist instead of three.
What goes wrong without it. Multiple churn-rate measures exist, each with subtly different filters or denominators, and the question “which one should this report use?” gets a different answer depending on who you ask. Within a quarter, the same KPI produces different numbers across three reports for reasons the team has no clean way to explain.
Layer 3: Consumption logic
What it is. Time windows, lifecycle slices, dynamic user selections. MTD, QTD, YTD variants. Comparison periods. Dynamic KPI selectors. Segment-specific cuts. This layer references business measures, not raw columns. A Ramadan-window churn cut, a Ramadan-versus-non-Ramadan ARPU comparison, a Q1-versus-Q1 watch-hours variance: all of these belong here, all of them reference the Layer 2 measure underneath.
Why it matters. Layer 3 is where the temporal-stance decisions live. Every business measure has an implicit time window, but Layer 3 makes the window explicit so it can be reused across reports and compared apples-to-apples across periods. The discipline of building consumption measures on top of business measures (rather than re-deriving from base) is what keeps the underlying definitions consistent across time variants.
What goes wrong without it. Time-intelligence logic gets re-implemented in every report. Each report writes its own MTD calculation against the base measures, the calculations drift, and the post-quarter retrospective becomes a reconciliation meeting because the same business measure renders differently depending on which report’s MTD logic ran. The temporal stance gets lost in the implementation noise.
Where I would start
If you can only audit one layer in your existing model, audit Layer 1. A base measure with hidden logic is the leak that compounds the fastest: every business measure built on top inherits the hidden behaviour, and once the inheritance chain is two deep the audit cost is exponential.
After Layer 1 is clean, audit Layer 2 for naming and dependency consistency: every business measure should reference base measures only, and the names should make the reference graph readable. Layer 3 audits come last because Layer 3 measures break loudest when they break (a wrong MTD calculation shows up in every report that uses it), but they also fix fastest once the underlying business measure is correct.
One MENA-flavored note
The Layer 3 (consumption) discipline pays back fastest in Arabic-OTT, because the Ramadan windows force every comparison measure to declare a temporal stance. “ARPU in Ramadan” and “ARPU compared to the equivalent pre-Ramadan window” are different measures with different filters; if both live as ad-hoc DAX in report files, each team writes its own version and the post-Ramadan retrospective becomes a reconciliation meeting. A dim_date table with explicit Ramadan flags (minus-30, in-Ramadan, plus-30) plus Layer 3 measures that reference those flags collapses the variance to one canonical comparison per KPI.
Closing
Are your DAX measures a library or a graveyard?
A library has organised layers, named owners, and dependency graphs that hold. A graveyard has measures with similar names doing different things in different reports, and no one alive who can explain why. The Three-Layer DAX Stack is what keeps the library from turning into the graveyard. The discipline is the layer constraint; the payoff is that hundreds of report queries reuse the same governed measure without drift.