Enterprise Semantic Layer & KPI Framework
One governed definition of every KPI, so teams stopped reconciling conflicting numbers and report builds dropped 60-70%.
50% Faster
Query Performance
100+
Governed Measures
60-70% Faster
Report Build Time
Zero
Migration Downtime
Challenge
Ask four teams for last month’s active-customer count and you could get four answers off the same source data. “Active” quietly meant something different to each: trials counted or not, an account or an individual profile. Nobody was wrong, which is exactly why every reconciliation meeting ran long and settled nothing.
For a large subscription-based consumer business, that costs more than it looks. Every leadership conversation opened with “which number is correct?” instead of “what do we do next?”, and analysts spent their week proving numbers instead of analysing them. Underneath, the governed model that was supposed to be the tiebreaker had outgrown its premium-capacity reporting tier: refreshes were lengthening, queries were degrading, and buying a bigger tier only pushed the same ceiling further out.
- KPI logic lived inside individual report files, so the same measure drifted into three shapes across the estate and nothing in the build pipeline caught it.
- There was no central, documented definition anyone could point to. The truth lived in whoever happened to write the report.
- The reporting tier was at its memory ceiling, so the fix had to be an engine change, not just better governance, and it had to land without taking live dashboards down.
Approach
Two calls carried the rest of the work.
The first was the engine. The easy option was to buy a bigger capacity tier. I moved the model to SSAS Tabular instead, served to Power BI over live connection. A bigger tier is a recurring bill that returns you to the same ceiling at the next volume step; a dedicated tabular engine gave explicit partition control and real memory headroom, and the live connection meant report files stopped importing their own data and started consuming governed measures by name. That is what made the model the single source of truth rather than one copy among many.
The second was how the measures were built. An audit of one high-traffic KPI had come back with three different formulas across three reports, none agreeing for the same period. A model alone does not fix that: without discipline above it, the same KPI keeps taking new shapes. So I built the measures in three layers. Base measures do nothing but aggregate. Business measures (net adds, churn, ARPU, retention) compose only from base measures. A consumption layer for time-intelligence and segment cuts composes only from business measures. Every governed measure got a published contract: its meaning, its grain, what it includes and excludes, a validation query, and a named owner. A measure with a contract is one the next person can pick up without a phone call.
Around those two decisions sat the operational work:
- 100+ governed DAX measures across four business domains, refreshed by domain-specific incremental partitions: one day for fast-settling data, a multi-week window for late-arriving attribution, sequenced through a staging, dimension, fact, then model-process loop.
- Every KPI change routed through three release gates: owner approval, a regression suite against pre-release baselines, and a documented rollback path before deploy. An earlier deploy had reset partitions and user roles because the rollback was improvised, so these gates exist to make sure that does not happen twice.
- A weekly monitoring loop over query statistics and capacity, where each slow query is traced to its layer (model, refresh, or report) and given an owner and a close date.
The migration ran in parallel with live reporting. Old and new stayed up side by side until each report passed an equivalence check, so nothing went dark during the cutover.
Results & Impact
- Report teams stopped rebuilding KPI logic per file. New dashboards start from shared governed measures, and build time dropped an estimated 60-70%.
- Query performance improved roughly 50% on the dedicated engine, and the capacity ceiling that triggered the project is gone. The whole estate migrated with zero reporting downtime.
- Metric disputes now resolve to “check the measure contract” instead of “ask which team’s calculation.” Leadership meetings start on the decision, not on which number to trust.
- The governed measure set became the reference cited in documentation and onboarding, and the same trusted numbers now feed downstream ML and AI work instead of each team recomputing its own.
Architecture
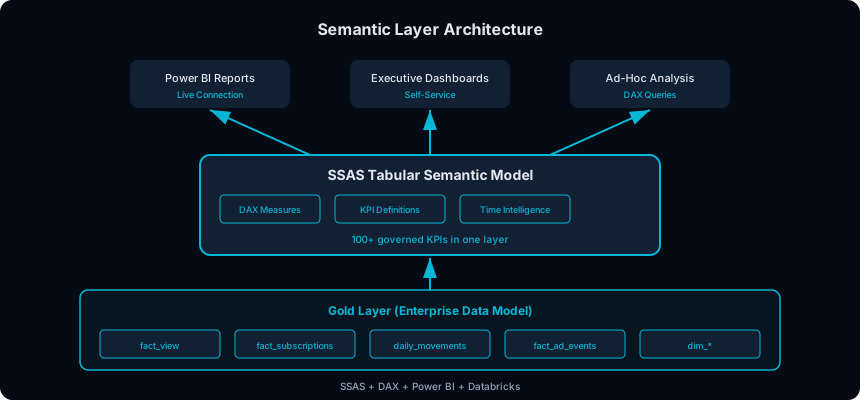
Conformed fact and dimension tables feed an SSAS Tabular model migrated off the premium-capacity tier. Inside the model, measures are layered base to business to consumption, secured by role, and refreshed by domain-specific incremental partitions. Power BI consumes governed measures by name over live connection, and the same model serves ad-hoc analysis. Release gates and a weekly monitoring loop wrap the model, so changes deploy safely and slow queries are caught before they reach a leadership review.
Tech Stack
- Semantic model: SSAS Tabular (SQL Server Analysis Services)
- KPI definitions: DAX (three-layer measure stack with per-measure contracts)
- Reporting: Power BI (live connection to the tabular model)
- Sources: SQL Server, Databricks (conformed Gold tables)
- Orchestration: SQL Server Integration Services (SSIS), Databricks Jobs
- Monitoring: SQL Server Extended Events, Dynamic Management Views, query statistics
My Role
I owned this end to end: the engine migration, the measure architecture, the governance gates, and mentoring the team on the DAX and SQL needed to maintain it. The pattern transfers to any business where several teams report different numbers for the same KPI and the governed model has started straining its reporting tier. The contracts and the layered measures earn their keep from day one; the dedicated engine only once you actually hit the ceiling.