Enterprise Data Foundation
One trusted model, feature store, and governed semantic layer across five source systems, so BI, ML, and AI build on the same numbers instead of fighting over them.
5
Source Systems Unified
Millions
Profiles Modeled
45+
Engineered Features
4
Downstream Projects
Challenge
Five source systems, five schemas, and no shared model underneath any of them. Every team wrote its own SQL straight against raw tables, so the same KPI came back with a different number depending on who ran the query. The reconciliation tax was real, and it grew with every new report.
For a large subscription-based consumer business, that fragmentation gets expensive fast. Volumes were rising to the point where ad hoc queries against raw tables were going unstable, and the reporting estate on top, legacy dashboards with metric logic copied from file to file, had to be modernized onto a new foundation without ever going dark for leadership. The fix could not be a one-off cleanup; it had to be a layer everything downstream could stand on.
- Engagement, subscription and billing, catalog, and ad-delivery data lived in separate vendor platforms with incompatible schemas, so nothing joined cleanly.
- Each team rebuilt its own query logic against raw tables, and the same business question produced inconsistent KPIs across the estate.
- Growing volumes were making raw-table queries slower and less reliable, so the old habit was running out of runway.
- The legacy reporting stack and its duplicated metric logic had to move onto the new model in parallel with live reporting: no freeze, no downtime.
Approach
Two calls shaped the foundation.
The first was the shape of the curated layer. The simple option was a flat two-stage pipeline: land raw, transform once into a single consumption layer. The team built a three-stage medallion instead, with Bronze as immutable raw on S3, Silver as conformed fact and dimension tables, and Gold shaped as a shared feature store. A single consumption layer would have forced BI and ML to fork their own transforms off the same raw data, each recomputing the heavy feature engineering at query time. Giving each stage one job fixed that: Bronze decouples ingestion from modeling so schema changes replay without re-extracting from source, Silver applies cleaning and conformance once so every consumer starts from the same trusted facts, and Gold puts feature engineering in one governed place. That choice proved load-bearing as the downstream work expanded: segmentation, attribute inference, CRM automation, and a voice-of-customer platform all read from this layer rather than rebuilding from raw events.
The second was where to govern the KPIs, and that layer was mine. The semantic layer could either reach back to the source systems and rebuild the join and cleaning logic itself, or sit on the conformed layer and inherit it. I put an SSAS Tabular semantic layer on top of the conformed layer, served to Power BI over live connection. Building on Silver kept the model focused on business definitions instead of data plumbing, and the live connection meant report files stopped importing their own data and started consuming governed measures by name. Refresh was tiered by domain rather than run on one uniform cadence, because a single schedule would either under-refresh late-arriving ad attribution or waste compute reprocessing engagement data that had already settled.
- A three-stage medallion with explicit Bronze, Silver, and Gold responsibilities and table-ownership standards.
- Raw source payloads landed in Bronze on S3 as the immutable system of record, preserving full fidelity for replay and audit.
- Silver fact tables for core events and dimension tables for every core entity (customer, catalog, package, device, partner, promotion), plus a daily-movement table tracking new, churned, upgraded, downgraded, and reactivated events for cohort and churn analysis.
- A Gold feature store at individual-user grain across millions of profiles: 45+ features across six categories, refreshed incrementally over recent activity windows with in-pipeline quality checks before publish.
- The SSAS Tabular semantic layer I built on top: 100+ documented DAX measures across four business domains, with tiered incremental refresh matched to how each domain settles.
- The three-phase BI modernization I ran on it: legacy reports moved, repointed onto the new model, then report-level DAX consolidated into shared governed measures, validating equivalence at each phase gate before retiring any legacy asset.
Results & Impact
- Teams stopped maintaining parallel query logic and rebuilding KPI definitions per file. One shared model and one governed measure set replaced the fragmented per-team SQL that had been the source of every metric dispute.
- New dashboards built on shared measures run an estimated 60-70% faster to develop, and the full reporting estate moved through three architectural changes with zero downtime.
- Cross-domain analysis that used to need custom joins and reconciliation each time became reproducible, and questioned numbers now resolve to “check the measure-definition reference” instead of “ask which team’s calculation.”
- Every subsequent project builds on this layer. Segmentation, attribute inference, CRM automation, and the voice-of-customer platform all depend on it directly, so the foundation’s return compounds with each downstream use case.
Architecture
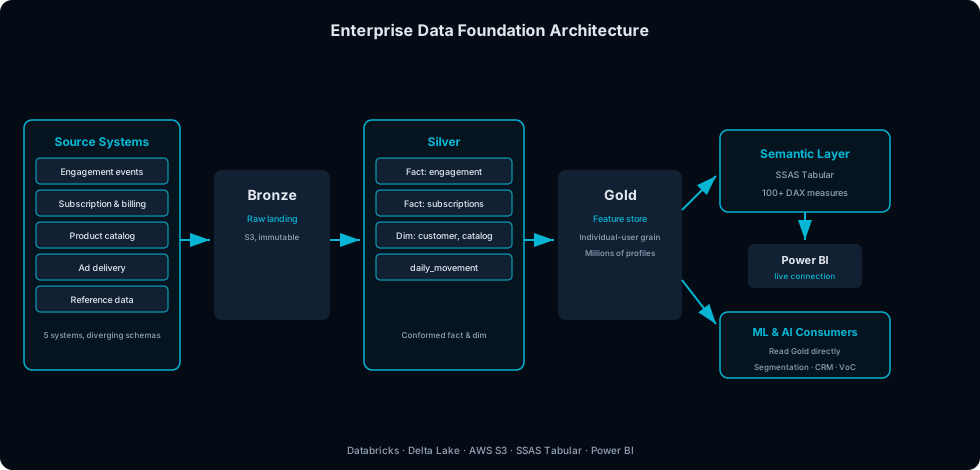
Five source systems land in Bronze on S3, then flow into Silver conformed fact and dimension tables and a Gold feature store. BI consumes Silver through a governed SSAS Tabular semantic layer served to Power BI over live connection; ML, personalization, and downstream AI consumers read Gold feature tables directly.
Tech Stack
- Platform: Databricks (PySpark, Spark SQL)
- Storage: AWS S3, Delta Lake (ACID transactions)
- Semantic layer: SSAS Tabular, DAX
- Reporting: Power BI (live connection), Tableau (legacy, migrated)
- Orchestration: SQL Server Integration Services (SSIS), Databricks Jobs
- Access management: Azure Active Directory
My Role
This was a team effort and one of my first projects on the platform: two to three data engineers, four to five analysts and data scientists, and me among the analysts. The data model itself, the medallion and the Gold feature store, was the team’s work. What was mine was the governed semantic layer and KPI framework on top of it (its own case study) and the phased BI modernization that moved the reporting estate onto the new model without a freeze. The pattern transfers to any organization with siloed sources and growing BI, ML, and AI ambitions: model once, govern the KPIs in a layer on top, and migrate in parallel rather than at a hard cutover. It is overhead you do not need if your data fits one database and a small team runs exploratory work; it earns its keep once you have multiple downstream consumers and source schemas that genuinely diverge.