Phased BI Modernization
Tableau to Power BI to a governed semantic layer, with leadership reporting never going dark for a day during the migration.
3
Migration Phases
35%
Report Maintenance Reduction
40%
Report Adoption Increase
Zero
Reporting Disruption
Challenge
Migration had to run in parallel with live reporting (no downtime, no data freeze) while Data Model was rolling out underneath, and report owners with varying technical depth needed enablement alongside the migration itself.
- Legacy stack dependency: Reporting was heavily coupled to Tableau and older data architecture that was being phased out
- Architecture transition overlap: The tool migration had to proceed in parallel with the Data Model rollout, requiring careful sequencing to avoid double-rework
- Consistency risk: Reports rebuilt at different times and by different people risked drifting in logic if not managed against a fixed target architecture
- Adoption risk: Teams needed continuity. A disrupted reporting experience during migration would erode trust in the new platform
Key Decisions
Decision 1: Three sequential phases rather than a single simultaneous migration
Problem: Migrating tool, data layer, and metric logic simultaneously is high-risk. Each dimension introduces its own failure modes.
Options considered:
- Full stack swap in one phase (fast, but high-risk and hard to roll back)
- Three separate sequential phases (slower, but each phase is independently verifiable)
Chosen: Three sequential phases with independent validation gates at each stage.
Why: Separating tool migration from data layer migration from metric governance allowed each phase to be tested and validated independently. If something broke, the blast radius was contained to one layer. It also allowed reporting teams to adapt incrementally rather than absorbing three simultaneous changes.
Decision 2: Parallel running with equivalence gates, not a hard cutover
Problem: A hard cutover would have forced a reporting freeze during migration. Leadership reporting cannot go dark, and a freeze concentrates risk into a single switchover event with no rollback path.
Options considered:
- Hard cutover with planned downtime (simplest, but business-disruptive)
- Parallel running with dual-write for the full migration (highest assurance, highest infrastructure cost)
- Parallel running with equivalence validation at each phase gate, retiring the legacy asset only after the new one is confirmed
Chosen: Parallel running with report-by-report equivalence validation at each phase gate before retiring legacy assets.
Why: Each report migrated independently with both versions live until equivalence was confirmed. Failures rolled back to legacy without business disruption, and the parallel period gave report owners time to adapt. Decisions 1 and 2 compose cleanly: three sequential phases bound the change axes, and parallel running within each phase keeps reporting continuous through the cutover.
Approach
- Phase 1: Migrated all active Tableau reports to Power BI, maintaining equivalence against legacy data sources; delivered training and support to report owners
- Phase 2: Migrated Power BI reports from legacy data sources to Data Model (Databricks Gold layer), standardizing on the new data architecture with validated measure equivalence
- Phase 3: Migrated report-level logic to centralized semantic layer measures, removing duplicated DAX from individual report files and replacing with shared, governed measure references
- Validated report-by-report equivalence at each phase gate, comparing legacy and new outputs against fixed test queries before retiring the legacy asset
- Coordinated cutover sequencing, ownership assignment, and stakeholder communication across all three phases
- Ran enablement and Q&A sessions at each phase to keep reporting teams productive during transitions
Architecture Overview
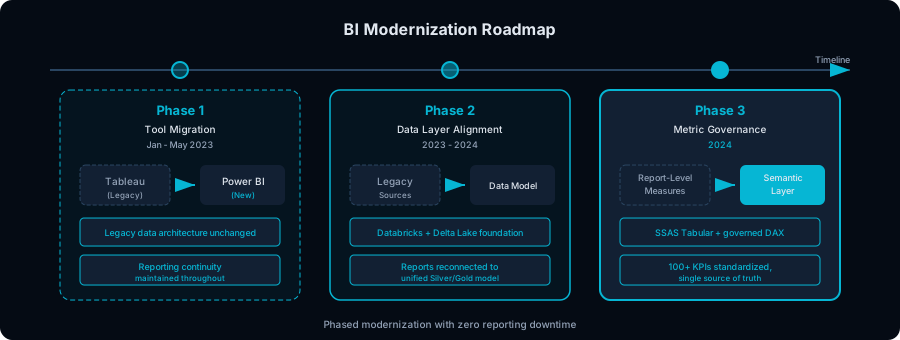
Three-phase modernization: tool migration (Tableau to Power BI), data layer alignment (legacy sources to the new Gold-layer data model), and metric governance (report-level DAX to centralized semantic layer).
Results & Impact
- What changed in operations: Reporting teams moved through three significant architectural changes without a reporting outage, maintaining business continuity throughout a complex, multi-month transformation
- What changed in governance: By end of phase 3, KPI definitions lived in one governed semantic layer rather than scattered across individual Power BI files, reducing the risk of metric drift with each new report or update
- Maintenance overhead: Changes to a shared KPI definition now propagate to all connected reports automatically. A significant reduction in the update-and-verify cycle that previously required touching each report file individually
- Foundation for future work: The completed modernization enabled all subsequent analytics, ML, and AI work to build on a clean, shared foundation
Reusable Pattern
This phased modernization pattern (tool transition to data layer alignment to metric governance) applies to any organization upgrading analytics platforms:
- Phase 1: Tool transition with continuity (migrate reports, maintain equivalence)
- Phase 2: Data-layer alignment (point existing reports at new architecture)
- Phase 3: Metric governance standardization (consolidate logic into shared layer)
The sequence reduces delivery risk and avoids big-bang migration failures. Each phase is independently testable and reversible.
When this pattern is NOT appropriate: If your BI estate is small (fewer than 10-15 active reports), the overhead of a phased program isn’t justified. A direct migration is faster. Similarly, if your organization is early-stage with no established reporting processes, building the governed architecture directly is preferable to migrating from a legacy one.
Tech Stack
- Reporting: Tableau (legacy), Power BI
- Semantic layer: SSAS Tabular, DAX
- Data platform: Databricks (Gold layer), SQL Server
- Access management: Azure Active Directory
- Sources: Youbora, Evergent, Google Ad Manager