Ad Inventory & Revenue Pipeline
Pacing shortfalls and inventory pressure surface during the campaign, in time to act, instead of reconciling make-goods after it ends.
Same-day
Pacing Visibility
Multi-week
Settlement Refresh
4
Operating Signals
Challenge
Delivery against booked commitments was tracked in a hand-rebuilt spreadsheet, so under-pacing showed up at end-of-flight, when the only lever left was the make-good. By the time the shortfall was visible, the campaign was already over.
For an ad-supported digital publisher, that gap costs real revenue. Pacing is only useful while there is still inventory to move it onto, and impressions do not settle cleanly: programmatic delivery keeps trickling in for weeks as late-arriving attribution lands, so any daily-only view drifts from the figures finance will eventually book. Three teams were reading the same source data and reaching three slightly different totals, which meant nobody fully trusted the dashboard.
- Pacing shortfalls surfaced too late to act on, because the booked-versus-delivered view was rebuilt by hand and only looked back at provisional daily numbers.
- Late-arriving attribution eroded trust: a daily view drifted from final settled figures, so finance kept a side spreadsheet running against the dashboard.
- Inventory was known in aggregate but blind at the placement level, so the soft windows where new ad-supported inventory would actually clear stayed invisible to planning.
- Ad-serving error categories hid inside aggregate impressions, quietly eroding effective fill rate while revenue still looked healthy, then surfacing weeks later in reconciliation.
Approach
Two calls carried the rest of the work.
The first was the refresh cadence. The simple option was daily-only ingestion, but a daily-only pipeline is always slightly wrong about programmatic, and those errors compound across a reporting week. A one-shot backfill on demand catches settlement but is reactive and bursty. I split the schedule instead: a daily operational refresh in an early-morning window for same-day decisions, plus a periodic historical sweep that re-pulls the recent multi-week settlement window. The moment finance keeps a side spreadsheet against the dashboard, the pipeline has stopped being the source of truth, so weekly revenue reports had to reflect final settled figures rather than provisional daily ones. Splitting the schedule separated the two use cases cleanly.
The second was where the derived fields lived. Four signals all needed the same derivations: ad format, ad type, device-category group, ad-unit ID parsed by regex. Deriving them per pipeline was simplest but guaranteed drift the first time the logic changed, since the same fix would have to land in four places. Pushing the derivation into the BI semantic layer put it in one place but made every consumer pay the cost again, and the Slack alerts could not read it at all. So I derived once at the staging layer and let every consumer read the same prepared fields. That made staging the contract: reporting, alerting, and ad-hoc queries all shared one definition, and a change to the logic touched one file.
- Built ingestion from the ad-serving platform’s reporting API into S3 raw storage and a Databricks staging layer, working within the API’s rate limits on scheduling.
- Implemented four operating signals as parallel pipelines: inventory (sellable inventory by placement, country, format), impressions (delivered ads and revenue), delivery pacing (actual versus booked), and serving errors (error categories trended over time).
- Applied derivation once at staging: ad format, ad type, device-category group, ad-unit ID via regex.
- Ran a daily operational refresh plus a periodic historical sweep over the recent multi-week settlement window.
- Wired Slack alerts to business-impact thresholds: pacing fires when a flight is on track to miss its commitment, and error alerts fire on sustained category shifts rather than transient spikes.
- Delivered Power BI dashboards on the staging layer, shared across ad operations, inventory planning, and finance.
Results & Impact
- Three teams stopped reconciling parallel spreadsheets and started working from one shared, settled view of supply and demand.
- Pacing alerts now fire during the campaign rather than after, leaving room to redistribute inventory or escalate to planning before a shortfall hardens into a make-good.
- Placement-level inventory gave ad operations a precise vocabulary to point planning at the specific ad units where new ad-supported inventory would actually clear.
- The multi-week sweep corrected late-arriving attribution, so revenue reports reflected final settled figures and finance retired the side spreadsheet.
Architecture
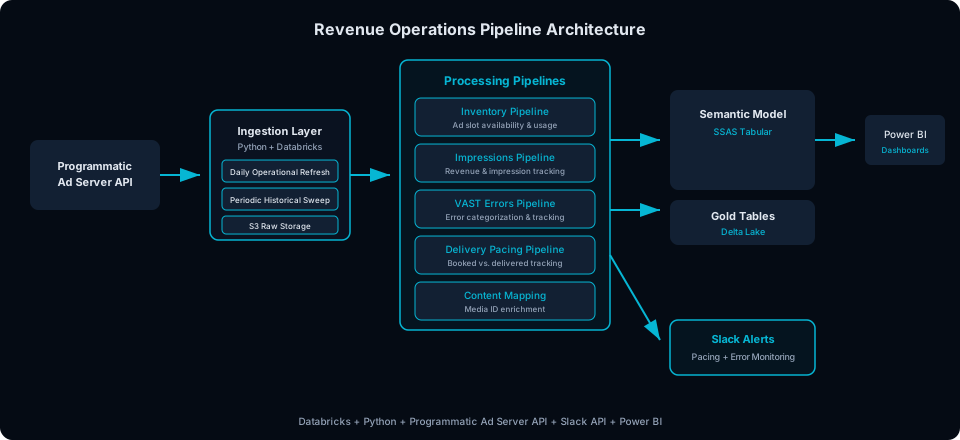
The reporting API feeds S3 raw storage and a Databricks staging layer, where derivation is applied once. Four downstream pipelines implement the operating signals, feeding shared Power BI dashboards and Slack alerts for the pacing and error events that need same-day intervention.
Tech Stack
- Ingestion: Programmatic ad-serving platform (Google Ad Manager) reporting API, Python
- Storage: AWS S3 (raw), Databricks Delta Lake (staging)
- Processing: PySpark, SQL
- Alerting: Slack (pacing and error alerts)
- Reporting: Power BI
- Orchestration: Databricks Jobs (daily and periodic schedules)
My Role
I owned this end to end: the ingestion against a rate-limited reporting API, the split refresh that reconciled daily decisions with settled reporting, the staging-layer contract that kept four signals consistent, and the alert thresholds I set with ad operations so every alert mapped to a lever someone could pull. The pattern transfers wherever one team reads the signals and a different team holds the lever that has to move, and where totals from several teams have to reconcile against the same source. It earns its overhead only when you need cross-source attribution, derived business logic that native reporting will not give you, or shared definitions across teams: if a native vendor dashboard already surfaces these signals against business-impact thresholds, build that instead.