BI to Data Science: The Three Ways the Transition Dies
A first-person account of the six-month overlap between BI ownership and DS delivery, and the three failure patterns that kill most transitions.
One Friday afternoon during the BI-to-DS overlap, two messages landed within an hour. The first: an AVOD engagement dashboard showing zero for last week. The second: a gender prediction model returning nulls for half the active profiles.
Same channel. Same engineer. Same governed tables underneath. Two different stakeholders, both waiting on me, both with reasonable expectations about turnaround. The afternoon turned into a forced ranking: which side gets the next two hours of attention, and which side gets a Monday-morning apology.
That kind of split is the moment most BI-to-DS transitions die. The temptation is to declare one side legacy and one side current, drop one, focus on the other. The data team becomes a DS team that lost its dashboards, or a BI team that wishes it was doing ML. Neither outcome is the one you wanted when you started the transition.
A BI-to-DS team is either keeping both sides of the overlap healthy or quietly abandoning one. Once it abandons one side, the team ends up with one capability and a credibility gap; once it keeps both alive, the data trust earned by years of accurate dashboards transfers to the ML output without being relitigated. The way you get there is not declaring one side legacy and one side current. It is a six-month overlap discipline that names the three failure modes the transition has to avoid on purpose.
Why this matters now
BI-to-DS transitions are common but rarely sustained. The typical pattern is a team that declares BI legacy, pivots attention to DS work, and discovers eight months later that nobody trusts the model because the dashboards stopped being maintained on the same engineer’s watch. The credibility transfer that should have powered the model gets blocked at the broken refresh job.
The reason is structural, not personal. Data-model discipline, stakeholder translation, and metric trust are exactly the skills that prevent ML projects from producing outputs nobody trusts. Walking away from BI to focus on DS strips those skills out of the team at the moment the team needs them most. The biggest misconception in the transition is that BI skills become irrelevant in DS work; in practice they reduce failure risk on every model that ships.
The three failure modes below are the patterns that turn an overlap into an abandonment. Each is independent. Avoiding all three is what makes the transition compound rather than collapse.
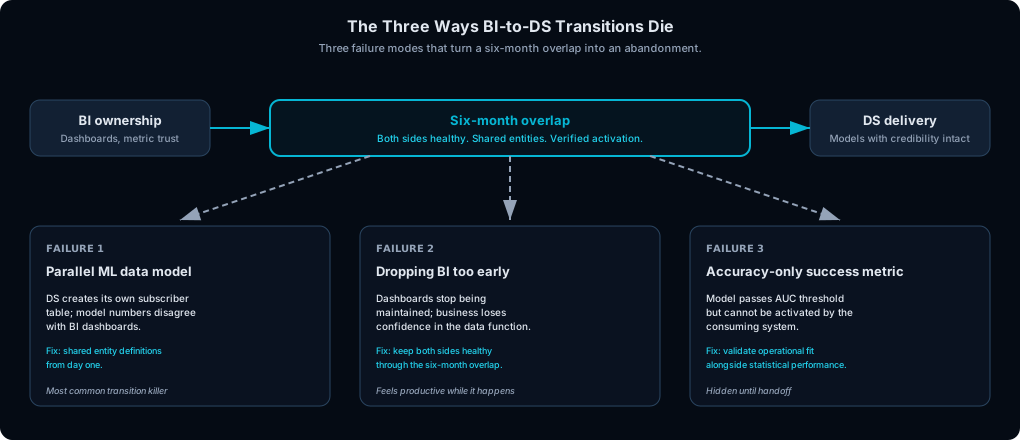
Three failure modes turn the six-month overlap into an abandonment. Each is a different off-ramp; the corrective discipline lives in the spine.
The Three Ways BI-to-DS Transitions Die
Failure mode 1: Building a parallel ML data model
What it looks like. The data-science workstream creates its own subscriber table with slightly different lifecycle definitions, different date cutoffs, or a different way of handling trial accounts. The model works fine in isolation, but its numbers disagree with the BI dashboards. Stakeholders notice. Trust erodes silently.
Why it kills the program. This is the most common failure. By month four, the data team is in reconciliation meetings instead of building, and the team’s bandwidth is spent litigating numbers instead of shipping features. The 15,000-versus-12,000 churn-count gap that ends transitions starts here.
What to do instead. Enforce shared entity definitions from day one. Same dim_subscriber, same lifecycle flags, same date spine for both dashboards and models. If the entity table is shared, the model and dashboard cannot structurally disagree, and stakeholders asking “why does the model say this subscriber is at risk?” find the answer pointing to fields they already saw in the dashboard.
Failure mode 2: Dropping BI responsibilities too early
What it looks like. Dashboards stop being maintained or metric definitions drift while attention shifts to ML. The DS work feels new and ambitious. The BI work feels routine. Dropping the routine to focus on the ambitious looks like prioritisation.
Why it kills the program. It is actually a credibility transfer in the wrong direction. Business teams lose confidence in the data function overall, and they will not trust model outputs from someone whose dashboards started breaking on their watch. By the time the model is ready to land, the team has burned the goodwill that should have carried it.
What to do instead. Keep the BI side healthy through the overlap. The overlap period exists for a reason: it builds credibility for the new work by preserving trust in the existing work. The DS pitch on Wednesday lands better when Monday’s dashboard worked.
Failure mode 3: Treating model accuracy as the only success metric
What it looks like. A model has strong accuracy on a holdout set but fails in production: the output format does not match the consuming system, or the predictions are not actionable at the business cadence, or the score has to be thresholded and reformatted before the CRM tool will accept it.
Why it kills the program. A model that scores well but cannot be activated is incomplete work. The team that declared the model “done” at the AUC threshold has to come back and finish the activation step, while leadership is asking why a model the team called shipped is not actually shipping anywhere.
What to do instead. Validate operational fit as a formal check alongside statistical performance. Before a model is production-ready, the output format, schema, and refresh cadence have to be compatible with the consuming system on day one.
Where I would start
If you can do one thing in your overlap period to make the transition durable, share entity definitions from week one.
Every model the DS workstream builds should consume the same governed dimension tables the BI dashboards read. Not “a subscriber table.” The subscriber table. When stakeholders ask why the model says one thing and the dashboard says another, the answer should trace to the same row, the same column, the same definition. The trust that compounds in BI for years is the same trust that lets a model output land in a leadership review without being challenged on first principles.
One MENA-flavored note
The credibility transfer matters more in MENA, not because the technical work is different but because the trust networks are smaller and the same stakeholders see both sides of the data function. The executive who reviews dashboards in the Monday meeting is often the same one who hears the ML pitch on Wednesday. If the Monday dashboard was broken, Wednesday’s pitch starts at a deficit. Keeping both sides healthy through the overlap is not optional in markets where the audience for both is the same room.
Closing
Are you transitioning, or are you abandoning?
A transition is six months of overlap, two sides of the work alive at once, both stakeholders kept whole. Abandonment is dropping the BI work to chase ML and discovering eight months in that nobody trusts the model because the dashboards stopped being maintained. The transition pattern requires more discipline. It also produces the only outcome you actually wanted when you started: a team that can deliver both, on a foundation that compounds. The same overlap shape applies to the next transition, whichever one that is. The mechanics change. The discipline does not.