BI to Data Science Bridge Patterns: Four Moves That Stop the Numbers from Diverging
Four bridge patterns from a BI-to-DS transition: shared entities, careful feature promotion, use-first validation, and role evolution.
A quarterly review surfaced a churn model and a churn dashboard disagreeing on a few thousand profiles. The executive in the room asked which number was the right one. The answer needed to fit in one room. The same conflict had surfaced six months earlier in a different review, same shape.
Neither number was wrong. The model used a 30-day inactivity window to classify churn risk. The dashboard used a billing-cycle definition that only counted subscribers who had actually lapsed. Both were defensible. Both produced different numbers. A non-trivial set of names was now in dispute.
That kind of standoff is the conflict every BI-to-DS transition accumulates quietly until a leadership meeting surfaces it. The gap is not in the model or the dashboard; it is in the entity definitions underneath both. Most transitions discover this in the worst possible place: the leadership review. The bridge patterns below are what stop the accumulation before it shows up in the room.
A BI-and-DS team is either building on shared entities or building two parallel realities. Once it builds parallel realities, every model output triggers a reconciliation conversation against the dashboard it implicitly disagrees with; once it builds on shared entities, the same governed table powers both surfaces, and the model and the dashboard cannot structurally diverge. The way you get there is not better reconciliation logic on the back end. It is four bridge patterns applied at the entity layer, where the divergence would have started.
Why this matters now
Every additional consumer of a metric (a BI dashboard, an ML model, an AI agent, a CRM activation) is a fresh chance for the metric to drift unless it consumes the same canonical definition. The dbt 2025 State of Analytics Engineering Report reports that 80% of data practitioners now use AI in some form, and data quality is the most critical challenge they face. Translation: the number of consumers per metric has gone up, the discipline that keeps them aligned has not.
For a BI-to-DS team specifically the failure mode is concrete. The dashboard says 12,000 at-risk subscribers, the model flags 15,000, and the leadership conversation that follows is a reconciliation, not a decision. The four patterns below are what stops that conversation from happening.
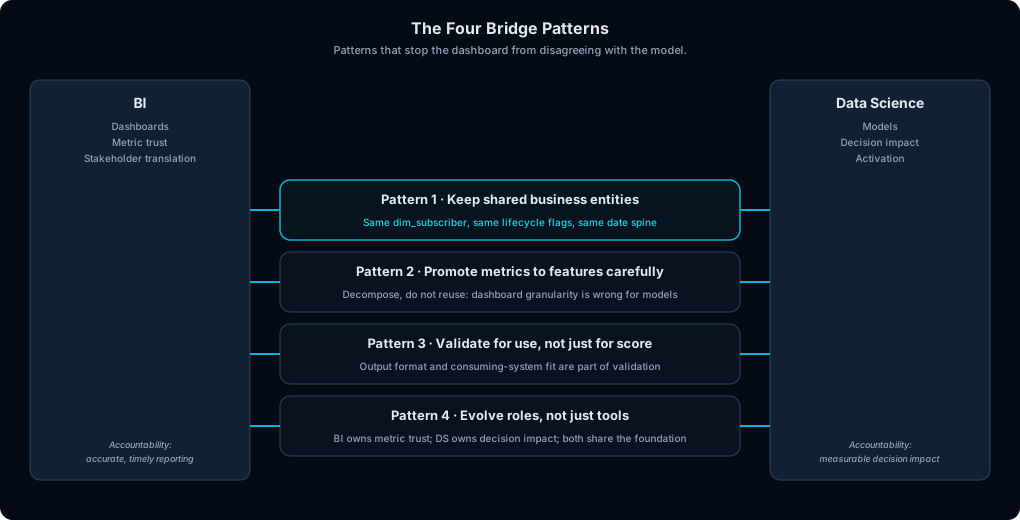
BI and Data Science are two parallel surfaces with different accountability. The four patterns are the bridges that stop them from drifting into parallel realities.
The Four Bridge Patterns
Pattern 1: Keep shared business entities
What it is. Reuse the same governed business entities that power BI. The concrete artefact is a dim_subscriber table: lifecycle status, plan type, registration date, tenure band, region. On the BI side it powers dashboard filters. On the DS side the same fields become input features for the churn prediction model. Plan type and tenure are strong predictors. Lifecycle status determines which subscribers are eligible for scoring at all.
Why it matters. Shared entities are the load-bearing wall of the whole bridge. Every other pattern degrades gracefully if skipped temporarily; this one does not. Because both BI and DS consume the same table, the dashboard-versus-model gap stops existing structurally, not just procedurally. The 12,000-versus-15,000 churn-count gap that ends BI-to-DS programs starts here.
What goes wrong without it. Every model the DS team ships has its own subscriber definition, each one slightly different from the dashboards. Every leadership conversation about the model becomes a reconciliation conversation. Trust erodes silently until a single visible disagreement surfaces all the invisible ones.
Pattern 2: Promote metrics to features carefully
What it is. Decompose BI metrics before promoting them as model features rather than reusing them directly. “Average monthly watch time” tracked engagement trends across subscriber segments on dashboards, but as a model feature it collapsed individual variation: a subscriber who watched 60 hours in week one and zero in weeks two through four had the same average as someone who watched 15 hours every week. What worked instead were profile-level behavioural signals (session count per week, content genre diversity over 30 days, days since last session, peak-hour viewing ratio) that preserved the variation the dashboard KPI smoothed away.
Why it matters. The right granularity for a dashboard is often the wrong granularity for a model. A dashboard summarises across users to spot a trend; a model needs the per-user variation that summary erases. Treating promotion as decomposition rather than reuse is what closes that gap.
What goes wrong without it. The DS team adopts BI metrics directly, the model’s signal washes out, accuracy stays mediocre, and the team blames the model when the failure was actually in the feature promotion.
Pattern 3: Validate for use, not just for score
What it is. Include downstream activation feasibility as a formal validation check, not just statistical performance. Before a model is production-ready, the output format, schema, and refresh cadence have to be compatible with the consuming system on day one.
Why it matters. A technically strong model can still fail operationally. A subscriber scoring model that passed every accuracy threshold (precision, recall, AUC all in target) stalled for three weeks during CRM integration because the model produced a risk score per subscriber and the CRM tool expected a binary segment flag with a specific schema. Score had to be thresholded, mapped, reformatted; the reformatting introduced delays and errors. Validating for use surfaces those gaps before the model ships, not three weeks after.
What goes wrong without it. The model ships, the CRM team cannot consume it, the integration becomes someone else’s problem, the project stalls. A model that scores well but cannot be activated is incomplete work.
Pattern 4: Evolve roles, not just tools
What it is. Make BI and DS accountability explicit as different jobs. BI accountability is metric trust and communication: maintaining dashboards, attending review meetings, ensuring definitions stay consistent. DS accountability is experimentation and inference: building features, training models, evaluating predictions against business outcomes. Both share the same governed data foundation, so neither side duplicates entity logic or reconciles conflicting numbers.
Why it matters. The temptation during a BI-to-DS transition is to treat it as a tooling upgrade: swap the BI tool for a notebook, swap SQL for Python. That misses the point. The real shift is in what you are accountable for. BI accountability is accurate, timely reporting. DS accountability is measurable decision impact. Both need the same data trust underneath, but the outputs and success criteria differ. Making that distinction explicit in role definitions, project scoping, and stakeholder communication is what makes the transition sustainable.
What goes wrong without it. A tooling-only transition produces a team that owns notebooks but does not own decisions. The ML output is presented to the business, the business does not know what to do with it, and the program quietly winds down.
Where I would start
If you can only do one of the four patterns first, do Pattern 1. Shared entities are the load-bearing wall. The other three patterns degrade gracefully if skipped temporarily: poorly promoted features hurt accuracy, weak validation slows activation, fuzzy roles cause confusion. Skipping shared entities causes the dashboard-versus-model gap that surfaces in leadership reviews. That conversation is the one that ends BI-to-DS programs.
Patterns 2 and 3 come next, in either order. Pattern 2 (careful feature promotion) buys back accuracy that a naive “reuse the BI metric” approach gave away; Pattern 3 (validate for use) buys back activation time that gets eaten by schema mismatches discovered late. Both are visible failures that the team will feel within the first model shipment, so they tend to get prioritised quickly once Pattern 1 is in place.
Pattern 4 (role evolution) is last because it can only be designed once the first three are running. Until then, the role definitions are theoretical; once a model has shipped, drift has been caught, and an activation has cleared validation, the natural responsibility split becomes obvious and can be documented from observation rather than designed in the abstract.
One MENA-flavored note
In MENA streaming, the entity that pays back the most from shared definitions is the profile, not the account. Households share accounts aggressively, and a model that scores at account level produces predictions that are an average across two or three distinct viewers. The dashboard that filters at profile level produces a different number. The dashboard-versus-model conflict often turns out to be an account-versus-profile mismatch when traced to source. Forcing both systems to operate at profile level eliminates the gap.
Closing
Are your model numbers explainable from your dashboard, or are they a parallel reality?
When the answer is parallel, every executive review eventually surfaces a “which number is right?” conversation, and the data team gets blamed for an organisational failure that was actually a modelling-discipline failure. When the answer is explainable, the model and the dashboard are two views into the same governed foundation, and a leadership question about either traces back to a definition both sides already trust.