AVOD Ad Operations: The Four-Signal Operating Loop
A four-signal AVOD operating loop replaced spreadsheet tracking and escalated inventory pressure to Content Ops before commitments slipped.
A booked campaign ended on a Friday short of its commitment. The pacing shortfall had been visible on Wednesday, actual delivery had been trending under the line for three days. In practice the pacing view was a spreadsheet someone in Ad Operations rebuilt by hand every morning, and the morning it would have mattered, they were clearing the booking inbox instead. By Friday the team owed the advertiser make-goods (the compensation impressions a publisher serves into a later flight when it under-delivers on a commitment), and those make-good impressions came out of inventory already sold to a different campaign. The shortfall propagated forward.
That kind of miss is the shape of reactive AVOD operations. Spreadsheets that someone has to remember to refresh. Trends visible only to whoever is looking at the right tab at the right moment. Numbers that do not surface until after the window to act has closed. The data exists, the people exist, the discipline exists. What is missing is the pipeline that puts the right view in front of the team at the moment it would change a decision.
An Ad Operations team is either acting on signals or chasing make-goods. Once it starts chasing make-goods, every flight ends in reconciliation and every soft quarter ends with nobody quite sure where the unused inventory was; once it starts acting on signals, Content Operations gets to move the supply lever before a shortfall hardens. The way you get there is not a fresher dashboard or another analyst. It is a single AVOD Operating Loop: four linked signals feeding one staging layer, one set of dashboards, and a small number of business-impact alerts the team will actually act on.
Why this matters now
There is one fact about AVOD that anything you build has to sit on top of. The platform controls supply. Demand sits outside the building. The only lever the team has from the platform side is inventory: how much sellable ad space exists, which content carries it, and how that maps to country and format. Impressions delivered and revenue earned are downstream of whether advertisers show up to spend, and that signal is exogenous to anything the platform can do directly.
The inventory lever does not sit inside Ad Operations either. Adding slots inside existing AVOD content, or extending the AVOD-eligible content footprint, is a Content Operations decision. So the operating loop runs across two teams: Ad Operations reading the signals and Content Operations moving the supply lever when those signals say it needs to shift, in either direction.
The operational signals that decide whether AVOD revenue lands are well known. The gap is not the data; it is the pipeline that turns the data into action.
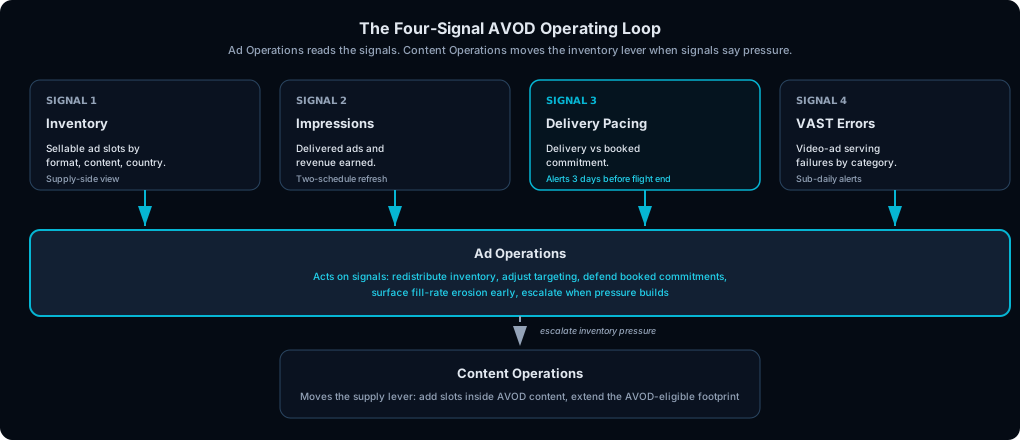
Ad Operations reads four signals to defend booked commitments. Content Operations moves the supply lever when those signals say pressure.
The Four-Signal AVOD Operating Loop
Signal 1: Inventory
What it is. Sellable ad slots. How much ad space is available to sell, broken down by format, content, and country. The supply-side view of the loop.
Why it matters. The lever does not live in Ad Operations. Growing inventory means opening more slots inside AVOD content or extending the AVOD-eligible content footprint, both of which sit in Content Operations. The Inventory signal exists, in part, to tell Ad Operations when to start that conversation: too thin to cover an upcoming peak, or sitting unused through a soft window where new content or repackaging would actually be sellable.
What goes wrong without it. Campaigns get booked against intuited capacity. Soft-quarter inventory clears even more slowly because nobody has a content-level view of where the unused pockets are. Overbooking on a peak window only becomes visible after delivery has already started missing commitments.
Signal 2: Impressions
What it is. Delivered ads and the revenue they generated. The core delivery signal. What actually ran, what it earned, how that breaks down across content, country and ad type. This is the pipeline that feeds the revenue dashboards Ad Operations shares with finance and commercial stakeholders.
Why it matters. Programmatic ad impression data does not settle immediately; late-arriving attribution means numbers can shift over a multi-week window after the original event. A daily pipeline that only looks at yesterday’s data will always be slightly wrong, and the errors compound over a reporting week. The solution is a two-schedule approach: a daily pipeline runs in an early-morning operational window to give the team fresh numbers for same-day decisions, and a periodic historical refresh re-pulls the recent multi-week window to capture corrections and late-arriving data. Monday morning revenue reports reflect final settled figures, not provisional daily numbers. This is the detail that separates a pipeline the team trusts from one they keep a side spreadsheet against, just in case.
What goes wrong without it. Weekly revenue numbers shift after the fact and finance loses confidence in the daily figures. The team starts keeping a side spreadsheet against the dashboard, which is the moment the pipeline stops being the source of truth.
Signal 3: Delivery pacing
What it is. Actual delivery against booked commitments. The ratio of what has been delivered so far to what was promised by the end of a campaign flight. This is the pipeline that feeds alerting, because a pacing shortfall discovered on the last day of a campaign is a missed revenue opportunity, and booked commitments are the one thing the team has to defend during peak windows.
Why it matters. The alert here is the most operationally important alert in the whole system. A pacing alert that fires three days before campaign end gives Ad Operations time to redistribute inventory across the existing book of campaigns, adjust targeting, or escalate to Content Operations to surface more inventory before the shortfall hardens into a make-good. The same alert fired on the final day is a post-mortem.
What goes wrong without it. Shortfalls become visible only at end-of-flight, when the only remaining lever is the make-good. The team spends the next flight working off a deficit instead of selling forward.
Signal 4: VAST errors
What it is. Video ad serving failures by error code, categorised. When a video ad fails to load or render, the VAST protocol returns an error category. The pipeline trends these errors over time and breaks them out by error class, player, and content vertical.
Why it matters. Trending these errors lets the team distinguish between transient player issues and systematic delivery problems that need intervention. A sustained shift in a specific error category across a content vertical, surfaced sub-daily, is the difference between catching a fill-rate erosion in the same week and finding out a quarter later, when finance asks why impression and revenue trends stopped tracking each other.
What goes wrong without it. Error spikes hide inside aggregate impression counts. Revenue looks healthy on the dashboard while an error category is silently eroding effective fill rate during the one window of the year when fill rate is least forgiving. The first signal that something is wrong arrives weeks later, after the window has already closed.
Alert thresholds: business impact, not technical anomaly
The single design decision that decides whether the loop is healthy is what triggers an alert. A technical anomaly alert fires when a metric drifts statistically; it is noisy and gets muted. A business-impact alert fires when a metric drift will affect revenue or campaign delivery; it gets acted on.
Pacing alerts do not fire because the pacing ratio dropped by some percentage from the mean. They fire when a campaign’s actual delivery rate puts it on track to miss its booked commitment by end-of-flight. The alert itself describes a decision, not just a data point. VAST error alerts follow the same logic: a brief spike is not paged; a sustained shift in a specific error category across a content vertical, surfaced sub-daily into Slack, is.
The alert vocabulary is the operating language of the team. Build the loop around the alerts the team will actually act on, not the alerts the dashboard happens to support.
Where I would start
The four signals are the end state. The way to actually arrive at them is incremental, and the order is dictated by trust, not by a roadmap.
The first deliverable is a single composite metric: sell-through rate. STR is Signals 1 and 2 expressed as one ratio: impressions delivered divided by inventory available, with a country and content cut. It is the simplest possible expression of the supply-and-demand gap, and the value it adds on day one is that Ad Operations gets one trustworthy view of how much of what they have is being sold. That single number is what earns the pipeline a seat at the table.
Once STR is trusted, the team will start asking for what sits underneath it: impressions broken out by content and ad type with the multi-week settlement refresh; inventory broken out the same way so unused pockets show up at the title level rather than as an aggregate slot type. That work follows naturally from the STR foundation, because by then the team has its own questions to point at.
The next deliverable is pacing, with the logic specified by Ad Operations rather than by the data team. The reason matters: pacing thresholds depend on flight-level commitments and prioritization rules that only Ad Operations knows in detail. A pacing alert built on data-team assumptions will get muted; a pacing alert built on Ad Operations’ own definition of what “on track” means gets acted on. Wired into Slack, this is the deliverable that converts the pipeline from a reporting tool into an operating tool. It is also the one that lets Ad Operations anticipate inventory pressure early enough to escalate to Content Operations before pressure becomes a make-good.
VAST error alerts come last, and on the same logic. Ad Operations eventually wants sub-daily Slack alerts that surface error-category shifts inside the day rather than at the next morning’s standup. By that point the working pattern is established: Ad Operations names the alert they want, the data team builds it, and the loop tightens by one notch.
One MENA-flavored note
The MENA AVOD year has two distinct shapes that the loop has to read accurately. Peak windows around Ramadan and end of year are booked-out periods where pacing alerts carry the most weight, because every committed flight is at risk of missing delivery against tight day-counts and the make-good cost is high. Soft windows the rest of the year are inventory-led: the same slots that were premium-priced during a peak clear slowly, and the question moves from “are we delivering what we sold?” to “where would adding ad slots or extending AVOD-eligible content actually be sellable?” That question is the one Ad Operations takes to Content Operations, and it can only be asked honestly with a content-level inventory view. Build the cycle awareness into the staging layer; the dashboards and the cross-team conversations inherit it.
Closing
Is your Ad Operations team acting on signals, or chasing make-goods?
When the answer is chasing make-goods, every flight ends with a reconciliation and every soft quarter ends with nobody quite sure where the unused inventory actually was. When the answer is acting on signals, the team operates from a shared, settled view of supply and demand, and the inventory lever gets pulled with Content Operations before pressure turns into a missed commitment. The four-signal loop above is the change that switches the answer. The way to get there is to ship the first deliverable, let the team pull the next one, and tighten the loop by one notch at a time.